NCERT Solutions Of Class 8 Maths Chapter 5 Data Handling
Introduction
Data are the collection of information describing about the quantity, facts and statistics. Sometimes data is represented graphically to give a clear idea of what it represents. There are different types of graphs like pictograph, bar graph, and double bar graph.
Pictograph: Pictograph represent the data using symbols.
Bar Graph : It display the information using bars of uniform width, their heights being proportional to the respective values.
Double Bar Graph: It shows two sets of data simultaneously. It is useful for the comparison of the data.
While organizing the data we will come to know about the terms like tally mark, frequency, upper limit, lower limit, class interval.
The table we made is known as frequency distribution table while the frequency is the number of times a particular entry occurs.
Class 8 Maths Exercise 5.1 (Page-76)
Q1. For which of these would you use a histogram to show the data?
(i) The number of letters for different areas in a postman’s bag.
(ii) The height of competitors in an athletics meet.
(iii) The number of cassettes produced by 5 companies.
(iv) The number of passengers boarding trains from 7 a.m to 7 p.m at a station.
Give a reason for each.
Solution:
i) In, this case we can't use histogram to show the data as the given data is not in the form of intervals.
ii) 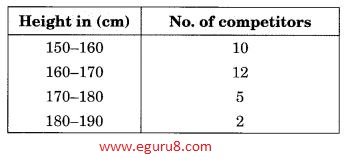
iii) In, this case we can't use histogram to show the data as the given data is not in the form of intervals.
iv) 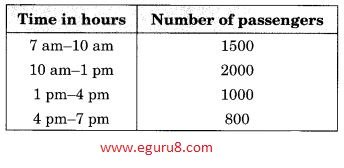
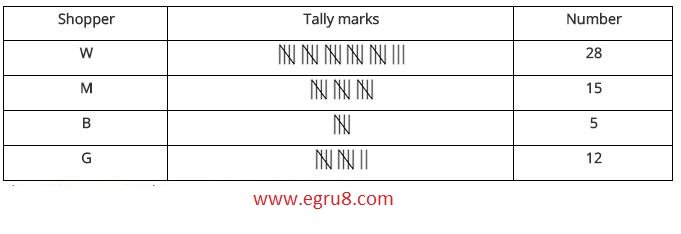
Q2. The shoppers who come to a departmental store are marked as: man (M), woman (W), boy (B) or girl (G). The following list gives the shoppers who came during the first hour in the morning.
W W W G B W W M G G M M W W W W G B M W B G G M W W M M W W W M W B W G M W W W W G W M M W W M W G W M G W M M B G G W
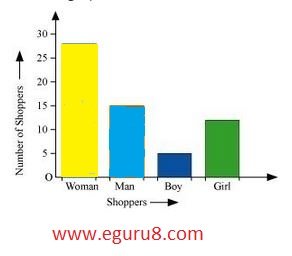
Make a frequency distribution table using tally marks. Draw a bar graph to illustrate it.
Solution:
Bar graph
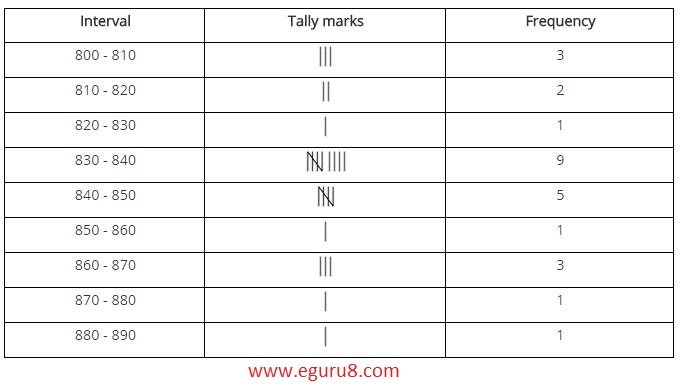
Q3. The weekly wages (in ₹) of 30 workers in a factory are:
830, 835, 890, 810, 835, 836, 869, 845, 898, 890, 820, 860, 832, 833, 855, 845, 804, 808, 812, 840, 885, 835, 835, 836, 878, 840, 868, 890, 806, 840
Using tally marks make a frequency table with intervals as 800-810, 810-820 and so on.
Solution:
Q4. Draw a histogram for the frequency table made for the data in Question 3, and answer the following questions:
(i) Which group has the maximum number of workers?
(ii) How many workers earn ₹ 850 and more?
(iii) How many workers earn less than ₹ 850?
Solution:
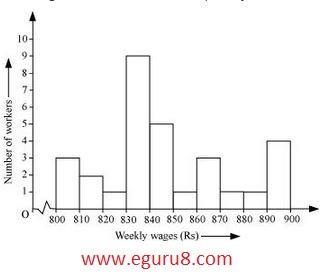
i) 830 -840 group has the maximum number of workers.
ii) 1 + 3 + 1 + 1 + 4 = 10
So, 10 workers earn ₹ 850 and more.
iii) 3 + 2 + 1 + 9 + 5 = 20
So, workers earn less than ₹ 850.
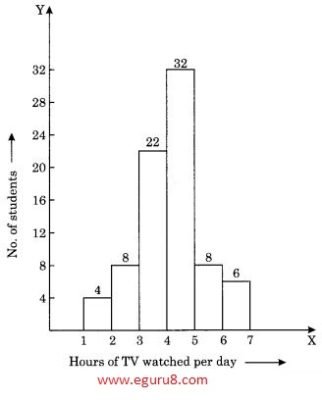
Q5. The number of hours for which students of a particular class watched television during holidays is shown through the given graph.
Answer the following questions.
(i) For how many hours did the maximum number of students watch TV?
(ii) How many students watched TV for less than 4 hours?
(iii) How many students spent more than 5 hours watching TV?
 .
.
Solution:
i) maximum 32 number of students watch TV 4-5 hours.
ii) 34 students watched TV for less than 4 hours.
iii) 14 students spent more than 5 hours watching TV.